
Complete Guide to Effective Vulnerability Dashboarding
Building purposeful dashboards in Kibana that simplify vulnerability management, meet stakeholder requirements, and provide a modular framework for evolving cyber security maturity.

Easily my lesser appreciated love within Vulnerability Management is dashboarding. If you’re working with any sort of reasonably-sized environment with a mix of workstations, servers, operational technology, and network devices, then any sort of vulnerability scanning will bring in large amounts of data, and typically not a great way to visualise it within the proprietary tools performing the scanning.
VM Scanning software like Tenable and Qualys provide ‘good enough’ solutions, but if you’re looking for more flexibility over data presentation, interactivity, improved readability, better user adoption, and more effective prioritisation; then investing in custom dashboarding may be the solution that you need.
This post got a little longer than I thought it would. I’ve included a TL;DR at the bottom, and there’s a helpful Table of Contents to the left-hand side if you’d like to skip around!
Principles of Dashboarding
There are 4 core principles I follow when creating technical dashboards:
Dashboards should answer at least one question in its entirety,
Stakeholder goals and objectives must be gathered and met,
Intended vulnerability outcomes should be documented and actively pursued,
Dashboards must incentivise regular reviews.
Dashboards should answer at least one question in its entirety
Consider the reason for creating the dashboard. What questions are being asked by the business, internal stakeholders, or yourself that you’d like to get a simple answer to? Questions could be:
“What vulnerability should I be most concerned about?”
“Which devices are most in need of patching?”
“Am I meeting my compliance objectives?”
“Which of my managers is performing the best/worst against our patching policy?”
A dashboard can answer one or many of these questions, but if an excessive amount of filtering is needed to get to the answer, you may need to consider separate dashboards that more effectively present the needed information.
Stakeholder goals and objectives must be gathered and met
I’m putting this principle above your own outcomes as I think this is the most effective way to enact change in the business. Unless you’re a one-stop security shop in your org, you’ll need other experts and owners in the business to support patching and back improvements to security culture.
Understand what these stakeholders want out of this service. Their requirements are likely to be much simpler than yours. They may not want to peruse the data with a fine comb, but instead see a simple list of “things to do,” whether that’s upgrades, patching, decommissioning, uninstalling etc. Create an environment that works for them and presents the data in the way that they want it, i.e.:
A director may want to review their team’s overall patching performance;
a Windows Server manager may want to see overall patch compliance across all Windows Servers;
a Linux engineer may want a per-device breakdown of critical, exploitable vulnerabilities that have lapsed the patch policy requirements.
Understand that every team and individual has their own metrics for success, and building a platform that enables them to enact change and demonstrate success within their own area creates a positive feedback loop for security.
Intended vulnerability outcomes should be documented and actively pursued
Ask what you hope to achieve through the creation and distribution of this dashboard. What are your team’s Key Performance Indicators (KPIs)? How will this dashboard enable either your team or other stakeholders to start contributing to the broader organisational objectives surrounding security and vulnerability management? Some objectives to consider:
Reducing number of active vulnerabilities that are not compliant to internal policy, i.e. critical vulnerabilities patched within 30 days, high within 60 days, medium within 90 days… etc.
Removing vulnerabilities that are not compliant to accredited standard guidelines, i.e. PCI DSS, ISO27001, Cyber Essentials+ etc.
Patch all vulnerabilities that have an exploit available, that are remotely exploitable, and are present on internet-facing devices.
Understand in your objectives that there’s a difference between security compliance and being secure. Security compliance is a requirement; good security posture is your goal. These concepts are often not related.
Dashboards must incentivise regular reviews
Dashboards should rarely be single-use. A dashboard used once is not a dashboard; it’s a report. While the interactivity of a dashboard for one-off events may be helpful, the strategic goal should always be to encourage and incentivise regular reviews of the content.
To better achieve this, you need to ensure that data is dynamic and as current as possible. Be consistent with your scan frequency. If Tenable scans occur daily, then ensure the information in your dashboard is updated daily. If the scans occur in the background every 4 hours, you better be updating that data every 4 hours, or at least setting expectations for regular updates.
If you follow the other principles listed and create something that answers key business questions, provides a solution to your stakeholders, and positively benefits your own KPIs, then regular reviews should be your indicator of success. If you are struggling to get that level of adoption, re-visit the other principles and consider where the failing is in the process.
Building a Demo Dashboard
To effectively demonstrate an example dashboard, I had to follow a few steps to ensure I wasn’t compromising security and still creating a live-like demo environment. I’ll be using Elasticsearch for data analytics and aggregation as I already have an environment ready to go; I’ll be generating dummy data with help from ChatGPT using Faker, and then building the dashboard with Kibana.
See the Appendix for the prompt used to generate the data if you’d like to follow my steps.
Vulnerability Overview Dashboard
Here’s a technical environment I generated with the following characteristics:
120 devices in scope with a mix of technologies between Windows 10, Windows Servers, RHEL, and some Cisco kit.
There are 5 managers in scope with different device responsibilities (i.e. Alice manages all the Win10 environment, Bob manages RHEL, Carlos manages Windows Servers, but Diana and Evan own a mix of both).
The internal patch policy is as follows (incredibly simplified for ease of use):
All Critical vulnerabilities must be patched within 30 days.
All High vulnerabilities must be patched within 60 days.
All Medium vulnerabilities must be patched within 90 days.
All Low vulnerabilities must be patched within 365 days.
The vulnerability data is randomly generated and doesn’t represent any real vulnerabilities, but is instead a random distribution of made up CVEs, severities, solutions, and EPSS scores.
Below is the dashboard in full that represents that environment1:

Service Level Agreement Metrics
Use filters to draw distinctions between vulnerabilities that are still within your Service Level Agreement (SLA), and vulnerabilities that have lapsed from their required remediation date. Here’s a very simple (and not recommended) example of Criticals being fixed within 30 days, Highs within 60 days, Mediums within 90 days, and Lows within 365 days. Adjust the values to your organisation’s policy.

((vulnerability.severity: "critical" and vulnerability.published <= now-30d) or (vulnerability.severity: "high" and vulnerability.published<= now-60d) or (vulnerability.severity: "medium" and vulnerability.published <= now-90d) or (vulnerability.severity: "low" and vulnerability.published <= now-365d))Kibana allows you to add buttons that filter on-click. Add a button that applies the non-compliance filter to the entire dashboard with one click to make it simple for stakeholders.

As any changes we make to the filter apply to the entire dashboard, the stakeholder viewing can then see which vulnerabilities have lapsed SLA and which to focus on first, either based on security improvement or vulnerability reduction, or even on a per-device basis.

Vulnerability Changes Over Time
By creating a historic data index, you can compare point-in-time data to see how data is trending.
Vulnerabilities History index takes a snapshot every 24h of the current vulnerability posture from the rolling index. This then allows point-in-time comparisons of data to see how the organisation is performing.

You can use the SLA metrics above to show changes in vulnerabilities for both the total and the non-compliant vulnerabilities:


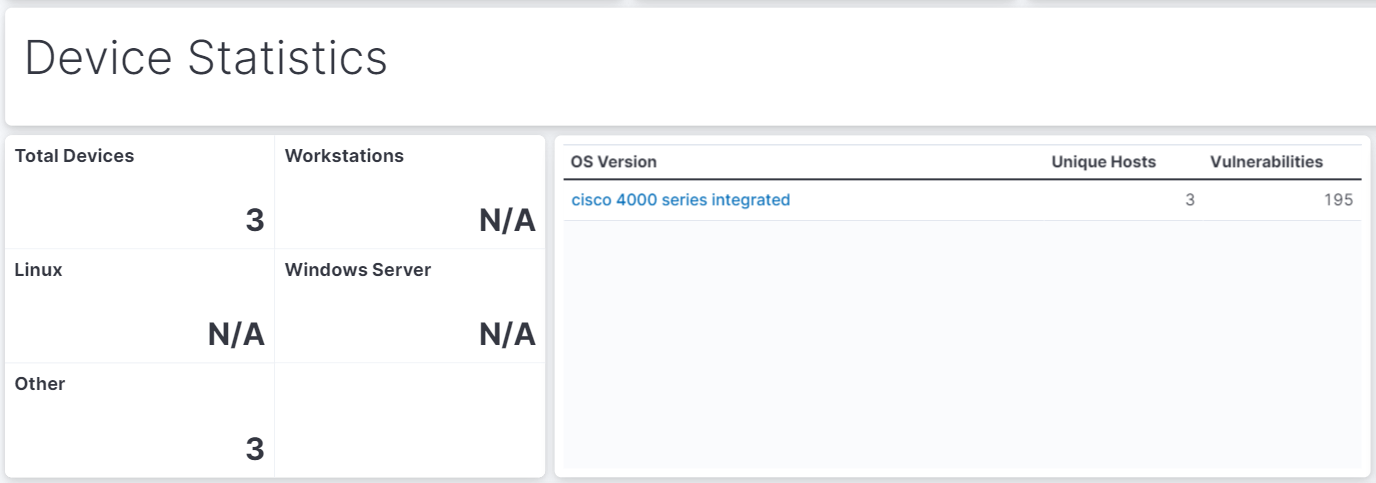
Identify Non-Standard Operating Systems
If you are conducting wide discovery scans that fingerprint the device OS, it can be useful to have an ‘Other’ category that isn’t one of your standard operating systems. This draws attention to anything on the network that isn’t part of your strategic deployment, or that you haven’t accounted for properly in your view.

Identify High-Impact Vulnerabilities
This is a really simple way to draw out the potentially high-impact and highly exploitable vulnerabilities in your network, especially when used in conjunction with the other filters available in the dashboard. The table below organises the CVEs by their EPSS rating and allows the user to navigate to the NVD page through a context menu.

If you’re filtering by device, OS, or owner, this can help to bring attention to the most exploitable vulnerabilities in scope.
Remember that just because something is highly exploitable, doesn’t mean that you are exposed - further checks will have to be conducted and could also be built into your filters to increase accuracy.
Identify Most-Effective Solutions
It may be beneficial to patch by solution rather than vulnerability. This can call out how many devices would benefit from the fix and how many vulnerabilities would be remediated. Good for compliance and KPIs.
If you instead wanted to focus on security benefits, you can filter the data to show the Maximum EPSS score that would be remediated if the solution was applied.

The above is a great example of showing that while more vulnerabilities would be remediated by applying the first solution, there is actually a more exploitable vulnerability that would be resolved by applying the third solution, mitigating the higher risk of exploit from 53 devices. The specific CVEs are shown on the left-hand side which can then be investigated further.
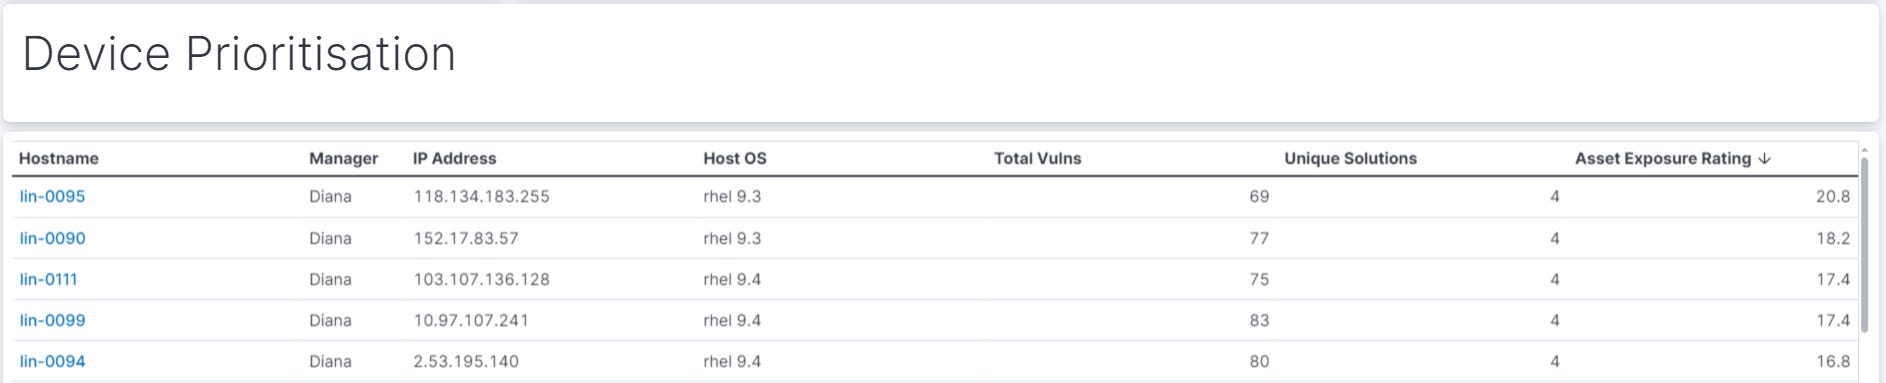
Identify High Exposure Devices
Another thing I’ve used the EPSS score for here is to provide an ‘Asset Exposure Rating’. This is simply a cumulative total of all EPSS scores affecting a device. As EPSS is represented as a decimal, by adding all of these scores together you can create a really simple way to call out potentially high exposure devices. This can be most effective when applied to internet-facing infrastructure or with more granular filtering of CVSS vectors (see External Attack Surface - Priority Patching dashboard below).
More Dashboard Ideas
I use the above dashboard as a template to create other dashboards that highlight vulnerabilities and compliance issues in other business areas. Here’s a few more ideas for dashboards that might be of some use.
External Attack Surface - Priority Patching
Here’s one I use for what I call ‘Priority Patching’, where I focus on web-facing devices that are affected by exploitable vulnerabilities with a Network attack vector, using CVSS vectors to filter the data:

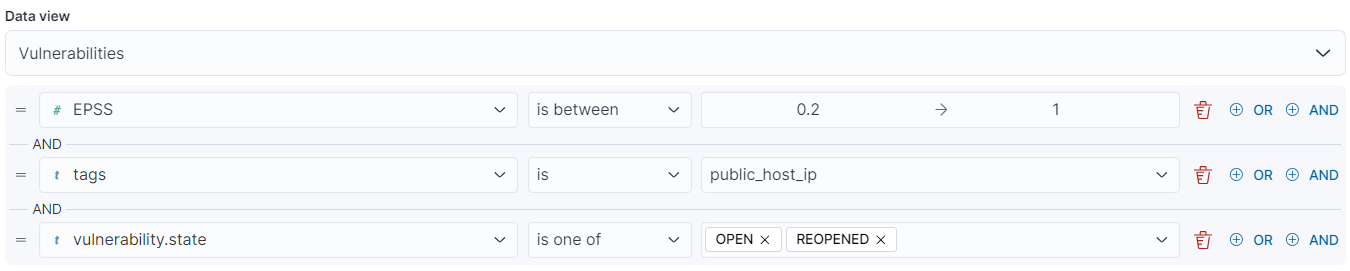
Filter below allows for more granular filtering against the CVSS vector and gives more control over the type of vulnerabilities that are shown that are most suited to your environment.
vuln.cvss3.vector : (*AV\:N* and (*Au\:N* or *PR\:N*))Vulnerabilities by Software
This dashboard element looks at Software by installs, their vulnerabilities, and a heatmap of contribution to the vulnerability total.

This can help to identify software that is significantly out of date or contributing a large amount of vulnerabilities to the total; thus better informing business decisions around approved software, End-User Device Management, and patching procedures.
Compliance Standard Dashboards
This dashboard uses a custom tag for ‘PCIDSS’ that would group all of the assets that are in scope for PCI DSS compliance.

Further filters in the dashboard would enable the reported vulnerabilities to only show if they go outside of compliance of recommended PCI standards, i.e. the PCI standard typically only asks for Critical and High vulnerabilities to be remediated on the internal network by default, but Critical, High, and Medium on the external network:
vulnerability.severity : "medium" AND tags : ("PCIDSS" AND "public_host_ip")TL;DR and Conclusion
If that was as lot of writing and you have too many vulnerabilities to fix to read in detail, here’s the short version;
Follow these principles:
Dashboards should answer at least one question in it’s entirety,
Stakeholder goals and objectives must be gathered and met,
Intended vulnerability outcomes should be documented and actively pursued,
Dashboards must incentivise regular reviews.
Create a clean, readable, dashboard that can be changed easily with simple filters for multiple stakeholder needs - use the one above as a starting point if you need some inspiration.
Consider iterative improvements to make the above easier. Better tagging, better ownership information, more data ingested etc. See my other post on using Elastic as a SIEM if you’d like to explore more.
I set out to create a better framework for independent vulnerability dashboarding. Searching for solutions and guidance to this problem presents you with companies that are offering you a pre-built template, but not the principles behind what makes these successful, and often not the granular control that I want to have in this area.
My personal experience has been entirely with Elasticsearch and Kibana, but the same may very well be achievable with other vendors in this space. This post is here to provide a framework rather than a tutorial for Kibana, so hopefully you can take my experience and apply it to your own environment.
Consider reading some of my other posts on vulnerability management:


Appendix - Dummy Data Generation Script & ChatGPT Prompt
from faker import Faker
import random
import uuid
import json
import os
from datetime import datetime, timedelta

fake = Faker()

# Predefined data based on user requirements
cves = [f"CVE-2024-{i:04d}" for i in range(1, 149)]  # 148 unique CVEs
solutions = ["Apply the latest security patch", "Upgrade to the latest software version",
             "Implement input validation", "Restrict user permissions"]
managers = {"Alice": "Windows 10", "Bob": "Linux", "Carlos": "Windows", "Diana": "Mixed", "Evan": "Mixed"}

# Predefined hosts with consistent IPs and OS
hosts = (
    [{"name": f"end-{i:04d}", "ip": fake.ipv4(), "os": "windows 10", "manager": "Alice"} for i in range(1, 64)] +
    [{"name": f"win-{i:04d}", "ip": fake.ipv4(),
      "os": "windows server 2019" if i % 10 < 7 else "windows server 2016", "manager": "Carlos"} for i in range(64, 88)] +
    [{"name": f"lin-{i:04d}", "ip": fake.ipv4(),
      "os": "rhel 9.4" if i % 5 != 0 else "rhel 9.3",
      "manager": random.choice(["Bob", "Diana", "Evan"])} for i in range(88, 118)] +
    [{"name": f"cisco-{i:04d}", "ip": fake.ipv4(), "os": "cisco 4000 series integrated", "manager": random.choice(["Diana", "Evan"])} for i in range(118, 121)]
)

def assign_manager(host):
    os_name = host['os']
    if os_name == "windows 10":
        return "Alice"
    elif "windows server" in os_name:
        return "Carlos"
    elif "rhel" in os_name and host["manager"] == "Bob":
        return "Bob"
    else:
        return random.choice(["Diana", "Evan"])

# Adjust the managers based on the rules
for host in hosts:
    host['manager'] = assign_manager(host)

# Severity distribution percentages
severity_distribution = {
    "critical": 0.08,
    "high": 0.30,
    "medium": 0.41,
    "low": 0.21
}

def generate_epss_score():
    probability = random.random()
    if probability < 0.02:
        return round(random.uniform(0.901, 1.000), 3)
    elif probability < 0.12:
        return round(random.uniform(0.501, 0.900), 3)
    elif probability < 0.32:
        return round(random.uniform(0.101, 0.500), 3)
    else:
        return round(random.uniform(0.001, 0.100), 3)

# Dictionary to store consistent information for each CVE
cve_info = {}

def assign_cve_info(cve):
    if cve not in cve_info:
        solution = random.choice(solutions)
        severity = random.choices(list(severity_distribution.keys()), weights=severity_distribution.values())[0]
        epss_score = generate_epss_score()
        published_date = fake.date_between(start_date="-1y", end_date="today")
        cve_info[cve] = {
            "solution": solution,
            "severity": severity,
            "epss_score": epss_score,
            "published_date": published_date
        }
    return cve_info[cve]

def generate_vulnerability_data(hosts, total_entries):
    data = []
    for _ in range(total_entries):
        host = random.choice(hosts)
        cve = random.choice(cves)

        # Retrieve consistent CVE info
        cve_details = assign_cve_info(cve)
        first_seen_date = fake.date_between(start_date="-100d", end_date="today")

        entry = {
            "vuln.cve": cve,
            "vuln.epss.score": cve_details["epss_score"],
            "vuln.solution.action": cve_details["solution"],
            "host.name": host['name'],
            "host.manager.name": host['manager'],
            "host.ip": host['ip'],
            "host.os.name": host['os'],
            "vulnerability.severity": cve_details["severity"],
            "vulnerability.published": cve_details["published_date"].isoformat(),
            "vulnerability.firstseen": first_seen_date.isoformat()
        }
        data.append(entry)
    return data

# Generate 8,567 entries
vulnerability_data = generate_vulnerability_data(hosts, 8567)

# Write the data to a JSON file formatted for Elasticsearch bulk import
with open("vulnerability_data_elasticsearch.json", "w") as json_file:
    for entry in vulnerability_data:
        # Write the index metadata line and the actual document
        json_file.write(json.dumps({"index": {}}) + "\n")
        json_file.write(json.dumps(entry) + "\n")

print("Data successfully written to vulnerability_data_elasticsearch.json")
Here is ChatGPT’s simple interpretation of the conversation to generate the dummy data:
I need to generate 8,567 records of dummy vulnerability data for testing purposes, formatted for Elasticsearch bulk import. Here are the details and requirements:
Host Distribution:
A total of 120 devices:
63 Windows 10 devices, managed exclusively by Alice.
24 Windows Server devices, managed by Carlos. 70% of them should be Windows Server 2019 and 30% should be Windows Server 2016.
30 Linux Servers, with 80% running RHEL 9.4 and 20% running RHEL 9.3. Managed by Bob, Diana, or Evan.
3 Cisco Routers, with
host.os.nameas "Cisco 4000 Series Integrated". Managed by either Diana or Evan.
Manager Assignment:
Alice manages only Windows 10 devices.
Bob manages only Linux devices.
Carlos manages only Windows devices (Windows Servers).
Diana and Evan manage a mixture of Windows and Linux.
Vulnerability Data:
148 unique CVEs in total. Each CVE should have a consistent solution, severity, EPSS score, and vulnerability.published date.
Solution should be randomly assigned but remain consistent for each CVE. Possible solutions are:
"Apply the latest security patch"
"Upgrade to the latest software version"
"Implement input validation"
"Restrict user permissions"
Severity Distribution:
8% should be critical
30% should be high
41% should be medium
The remaining should be low
EPSS Score Distribution:
Majority of vulnerabilities should be <0.1
2% should be >0.9
10% should be >0.5
20% should be >0.1
Scores should have 3 decimal places (e.g.,
0.001)
Each record should have:
vulnerability.published: Random date between now and 1 year ago.vulnerability.firstseen: Random date between now and 100 days ago.
Field Names:
All field names should be in lowercase.
No Record Field:
The "record" field is unnecessary and should be omitted.
Output Format:
The output should be a JSON file formatted for Elasticsearch bulk import.
Each line should have an index action line (
{"index": {}}) followed by the actual document on the next line, with no extra newlines between.
Some issues with data generation here that could be improved upon. I didn’t stipulate enough solutions and they shouldn’t be distributed so evenly. Due to generating fake data, I couldn’t simulate vuln patching and vuln discovery over time to better emulate the ebbs and flows of a normal vulnerability environment, thus the historic data elements aren’t shown to be working here. I also left it a little too long to write this post so there’s quite a lot of ‘vulnerabilities’ that are out of compliance :)